One of the conclusions that I drew from my Recoil vs Muzzle Velocity experiment was that my reloading practices had some room for improvement. There were two slow rounds in one of the 10-round groups that disappointed me and I had suggested that it might relate to my bullet sorting method. I used this opportunity to create another experiment – to measure the impact of bullet sorting by weight, bearing length, and by base-to-ogive. Specifically, I wanted to compare the effects of firing the extreme cases side-by-side: (e.g. lightest vs heaviest, longest vs shortest).
To accomplish this, I measured, weighed, and remeasured around 500 bullets then fired 22 rounds at 600 yards and another 50 at 300 yards. I recorded these with a chronograph, chamber pressure gauge, and electronic target to make it easier to analyze the data. As usual, the raw datasets are available on GitHub.
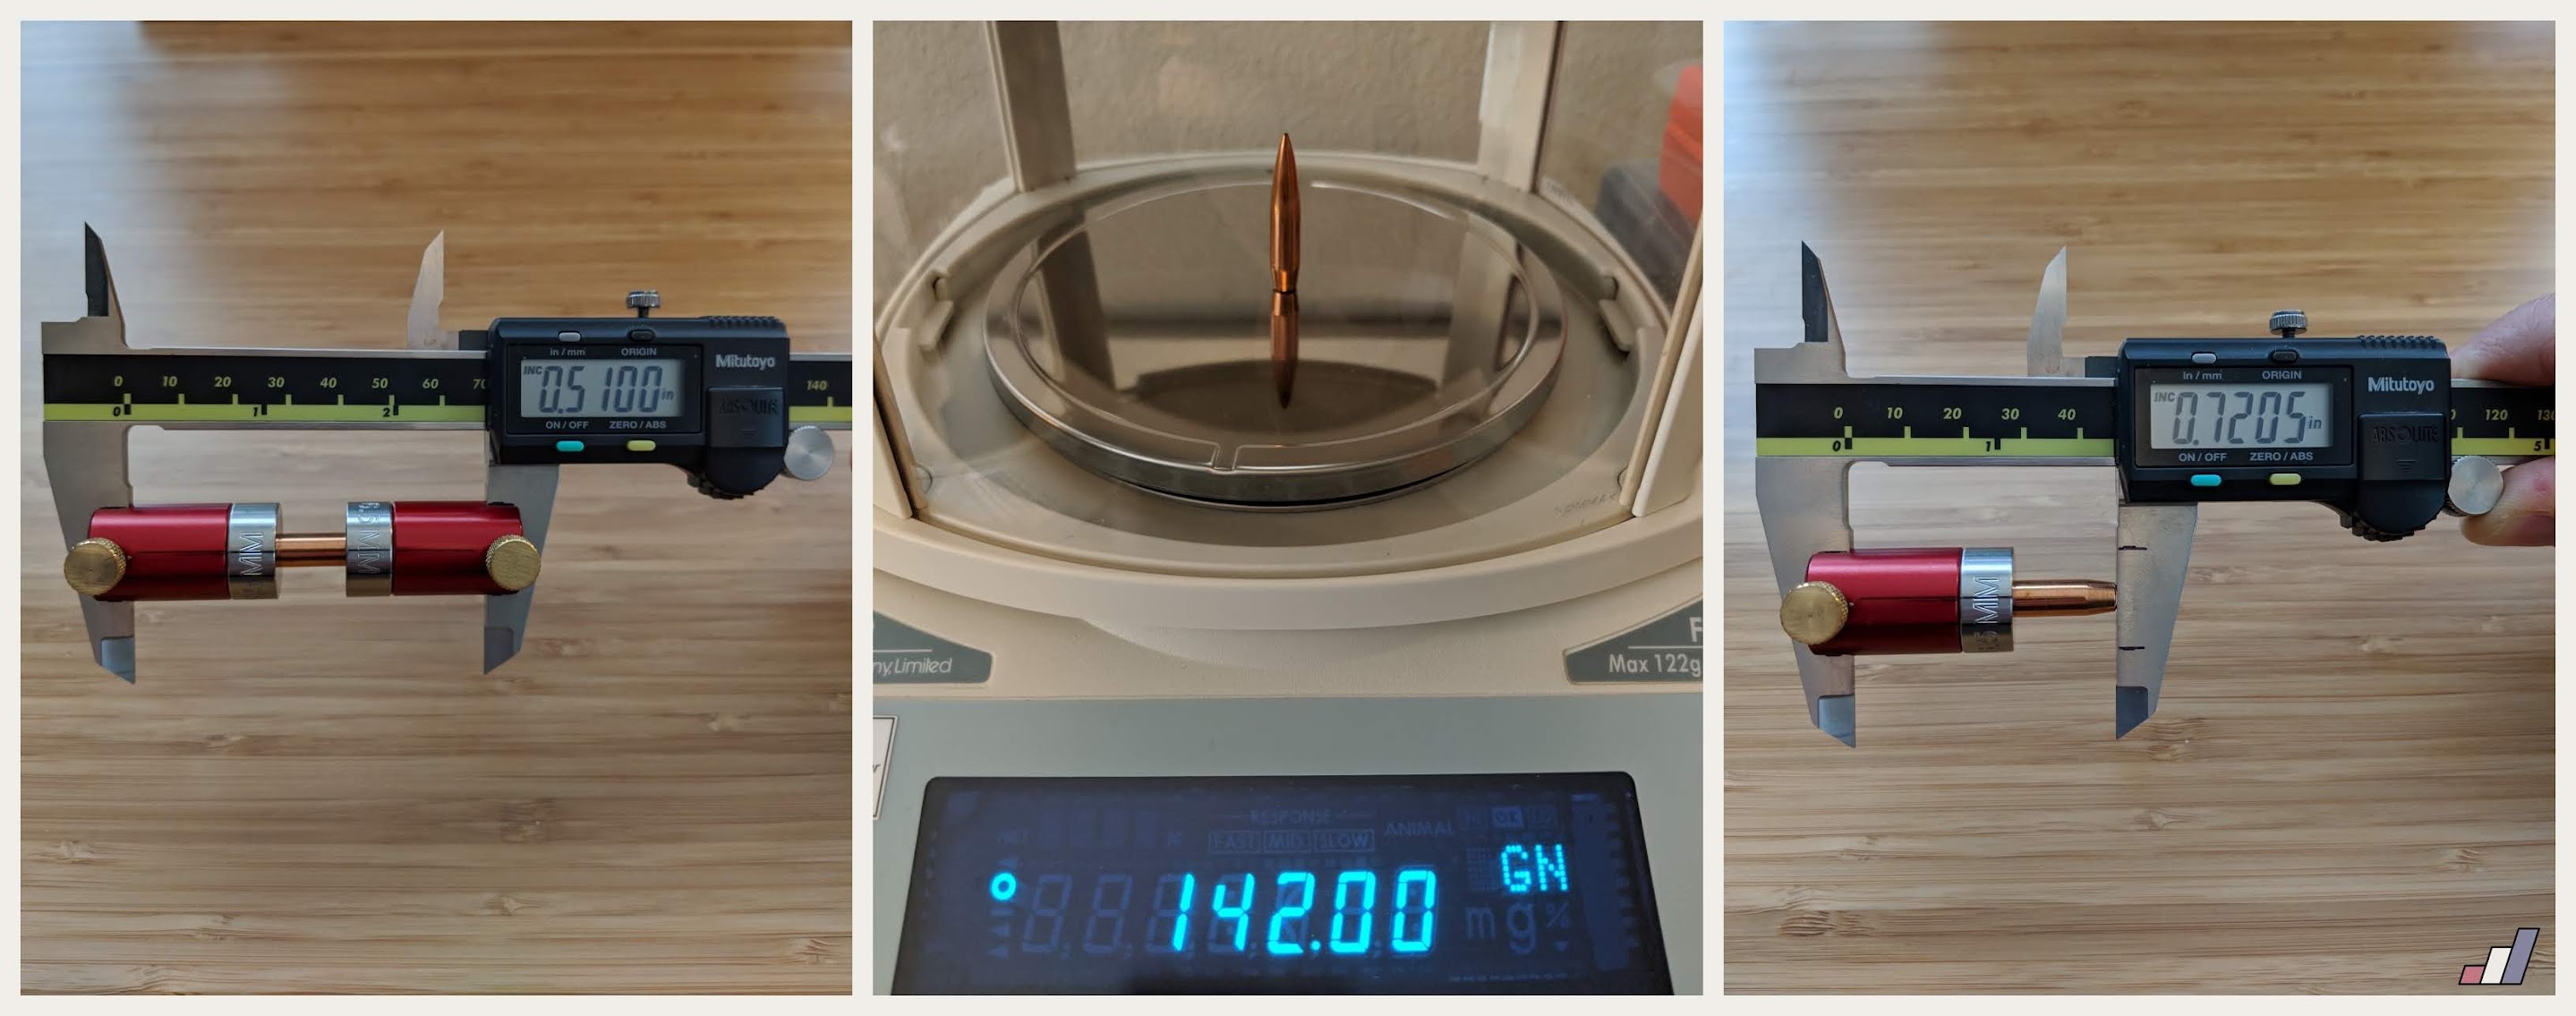
Table of Contents
Disclaimer
As you read this article, I only ask that you keep an open mind. As I detail my reloading practices and equipment, they will likely differ from your own. Some may be tempted to brush aside my conclusions due to these differences if they feel my methods are not up to their standards. I’m not making claims about the quality of my ammunition or my process. My goal here is to explore one variable at a time and to measure the impact it has on my load development and on my scores with my rifle.
Overview
Generally speaking, the idea behind sorting bullets for a precision rifle is to produce the most consistent ammunition possible by minimizing variation in every component. Reloaders have a lot of control over the two inert components (bullet and brass), and very little control over the two active components (powder and primer). As such, great care is taken to measure, modify, and sort the brass and bullets to ensure consistency.
I assume that most readers are already familiar with the different measuring points on a rifle bullet, such the ogive, base, and bearing surface. For those who aren’t, I recommend the following article:
Why Bother Sorting Bullets?
Intuitively, bullet sorting makes sense. You’d expect a heavier bullet to exhibit different exterior ballistics than a light bullet, resulting in a different point of impact on target. These effects should increase with distance and environmental conditions such as wind.
Similarly, one would expect a bullet with a shorter bearing length to affect the interior ballistics as it would experience less friction while travelling down the bore. The friction of the bullet’s bearing surface against the rifling lands should change the pressure curve and, as a result, the muzzle velocity.
Finally, you might also expect a bullet with a longer base length to change the amount of space within the brass, possibly crushing the powder. This may also affect the interior ballistics by increasing the initial pressure spike as the powder charge burns in a more compact area.
The question then is whether or not these effects can be quantified.
How Much Does it Matter?
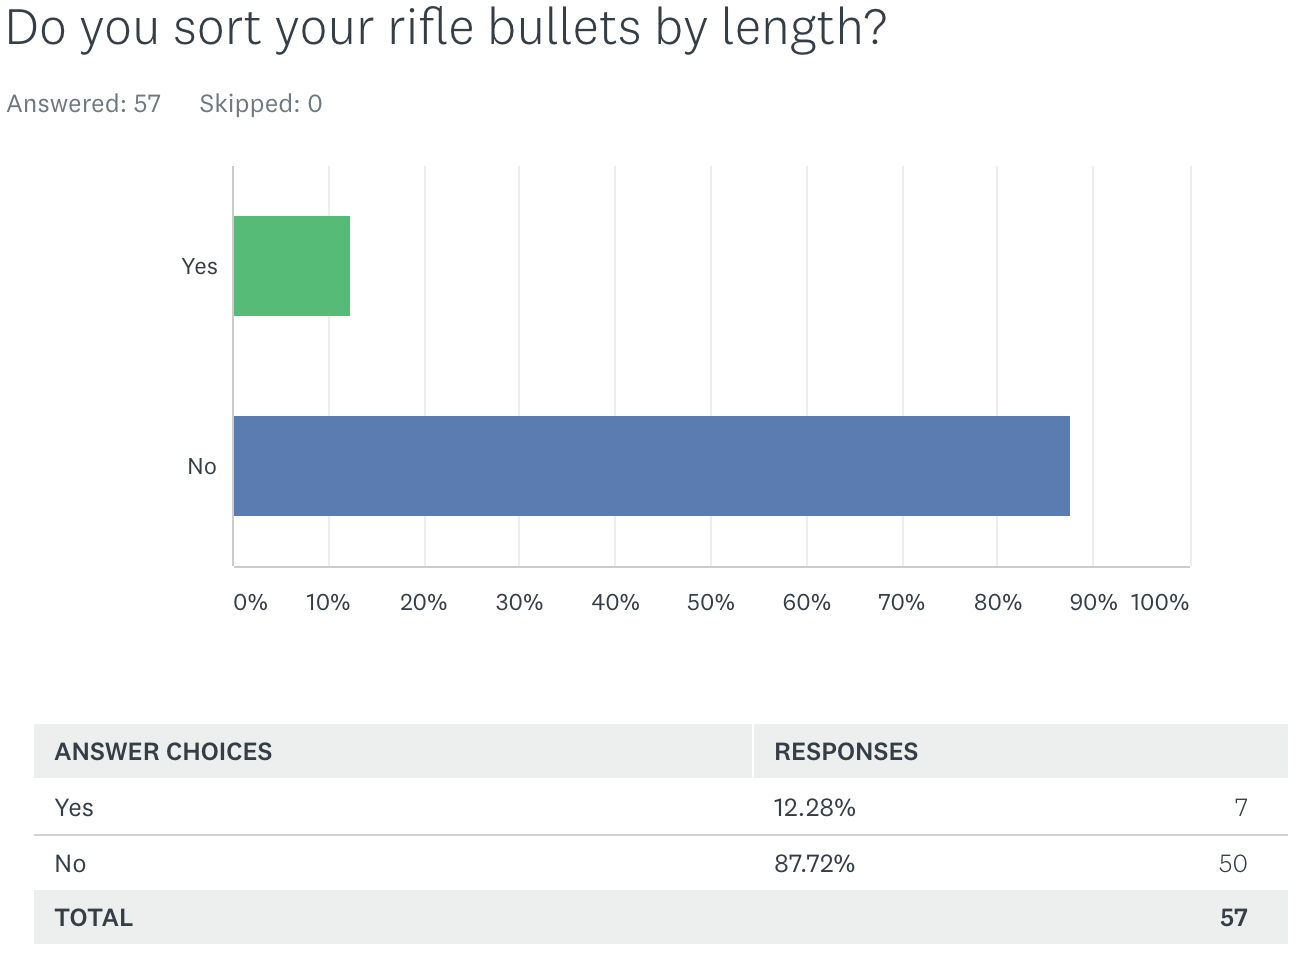
To get a better sense of how much it mattered to my readers, I asked a few questions about bullet sorting in a survey. Here are the results.


I turned to my bookshelf to see what experts had to say on the subject. Surprisingly, I did not find any mention of bullet sorting in a variety of books about reloading and precision rifles, including those from Bryan Litz. The following two books were the only to contain some references to this topic.
Army Material Command: Interior Ballistics of Guns

Referencing the Interior Ballistics of Guns section on Distribution of Energy, it states the following:
As an indication of the relative magnitude of the factors involved in utilizing the energy developed by the burning of the propellant in a medium caliber recoil gun, the following possible distribution is given:
| Energy Absorbed | % of Total |
| -
| Translation of projectile | 32.0 |
| Frictional work on projectile (Due to engraving of rotating bands and wall friction) | 2.0 |
| Translation of propellant gases | 3.0 |
| Heat loss to gun and projectile | 20.0 |
| Sensible and latent heat losses in propellant gases | 42.0 |
| Rotation of projectile and translation of recoiling parts (each about 0.1% and residuals in approximations total) | 1.0 |
| =
| Propellant Potential, E | 100.0 |
{:.striped}
Takeaways
If I understand their table correctly, 2% of energy is spent on frictional forces applied to the projectile and 32% is spent on moving the projectile down the barrel. Therefore, I’d expect an increased bearing surface or increased mass to affect these factors in moving the projectile.
If I don’t understand it correctly, please let me know.
Now, this doesn’t say anything about bullet sorting specifically, but I included it to add to our collective understanding about kinetic energy and internal ballistics.
Harold Vaughn: Rifle Accuracy Facts

I also referenced Rifle Accuracy Facts, which had this to say about Bullet Weight Variation:
Target shooters often weigh bullets and segregate them according to weight, because variations in bullet weight can cause a variation in muzzle velocity and bullet drop. Amvariation in bullet gravity drop will cause vertical dispersion. The problem is that no one seems to know how much effect bullet weight variation has on accuracy (vertical dispersion). Well we can calculate the effect of variation of bullet weight on muzzle velocity and measure it experimentally. Calculations with the internal ballistics code show that the fractional change in muzzle velocity for a given fractional change in bullet weight can be calculated from
$ (\delta V/V) = 0.24 * (\delta W/W) $where
$ \delta V = \text{change in muzzle velocity} $ $ V = \text{muzzle velocity} $ $\delta W = \text{change in bullet weight} $ $ W = \text{bullet weight} $From this equation we can see that a variation in bullet weight of one percent will result in only a 0.24 percent change in muzzle velocity. The reason that the muzzle velocity doesn’t change as much as one might expect, is that there is a compensation factor involved. The heavy bullet will cause the peak pressure to be higher and to peak earlier than that of the lighter bullet, thus providing a partially compensating effect. In order to check this theoretical calculation, Walter Jankowski of Cook Bullets made up some 6mm bullets in 65 and 75 grain weight in the same jacket with identical shape. This amounts to a 15.4% increase in weight, and according to the equation we would expect a 3.7% change in muzzle velocity. I test fired those bullets in a 6mm bench rest Heavy Varmint class rifle and got a variation of 3.2% in muzzle velocity using an Oehler 35P chronograph with six foot optical gate spacing.
Definitely interesting stuff and it gives us some equations that we can check later to confirm his conclusions. However, Harold goes on to say the following about Bullet Weight Variability:
Some bench rest shooters weigh their bullets and separate them into various weight categories. The question is whether or not all this work is worthwhile. I see no way to examine this problem other than to calculate both the internal and external ballistics effects of bullet weight variation of about ±0.1 grain about the mean weight on a 68 grain bullet (Figure 10-27). The extreme spread in weight will be between 0.3 and 0.4 grains. Heavier bullets will have a larger variation, but the percentage error will remain about the same.
So, I made an internal ballistics calculation to obtain the muzzle velocity on a 68 grain and 68.2 grain bullet to determine the difference in muzzle velocity. It turned out that the heavier bullet was slower by 2.2 fps. I then computed the impact point at 100 yards using the 6DOF trajectory simulation code with the different weight bullet at different velocities. The two bullets impacted at the same place within 1 mil. In other words, the 0.2 grain difference in weight made no practical difference in the impact point of the bullet. The reason for this is that there are compensating factors involved.
For instance, a heavy bullet doesn’t result in as low a muzzle velocity as one might think because it causes an increase in pressure over a lighter bullet.
This is not a simple proportional or linear problem. If you multiple the muzzle velocity of the 68 grain bullet by 0.2/68 you would get 8.8 fps if the problem was proportional compared to the correct change in velocity of 2.2 fps. Something similar happens in the external ballistics. Even though the heavier bullet starts out slower it doesn’t always slow down as quickly so that the flight time stays very nearly the same. As a result the bullet drop is very nearly the same.All of this tells me that sorting bullets according to weight is a waste of time – except for one thing. And that one thing is the possibility of detecting an unbalanced bullet.
He continues for a while describing the bullet production process and where errors might occur, then closes with the following:
If I were going to weigh bullets I would discard the very light ones, because they could have cores containing foreign matter and be unbalanced.
Takeaways
- Bullet weight variation has some influence on muzzle velocity and helpful equations are provided
- Heavier bullets should experience higher peak pressures
- Heavier bullets should reach peak pressure sooner than lighter bullets
- One experiment confirmed the predicted muzzle velocity variation
- Another experiment concluded no practical difference in bullet impact at 100 yards
- Mr. Vaughn is of the opinion that bullet sorting by weight is mostly a waste of time, except to discover manufacturing defects
There’s certainly some interesting and useful information in these sections of this book. I would point out that if you were to tell a competitive marksman (benchrest and F-Class in particular) that they could shave 2.2 ft/s of variation off of their muzzle velocity range (extreme spread), I’m confident that most would follow that advice.
I’m not entirely convinced by his experiment at 100 yards to measure bullet drop. I understand that it helps to eliminate environmental noise (e.g. wind, mirage), but it’s also such a close distance for a benchrest rifle that it’s difficult to distinguish signal from general variation in group size.
Regardless, let’s use what we learned here and conduct experiments of our own.
How I Measured & Sorted
To avoid errors due to thermal expansion or equipment sensitivity, I took all measurements from the temperature-stable (68°F) environment of my home office. My spouse was not amused.
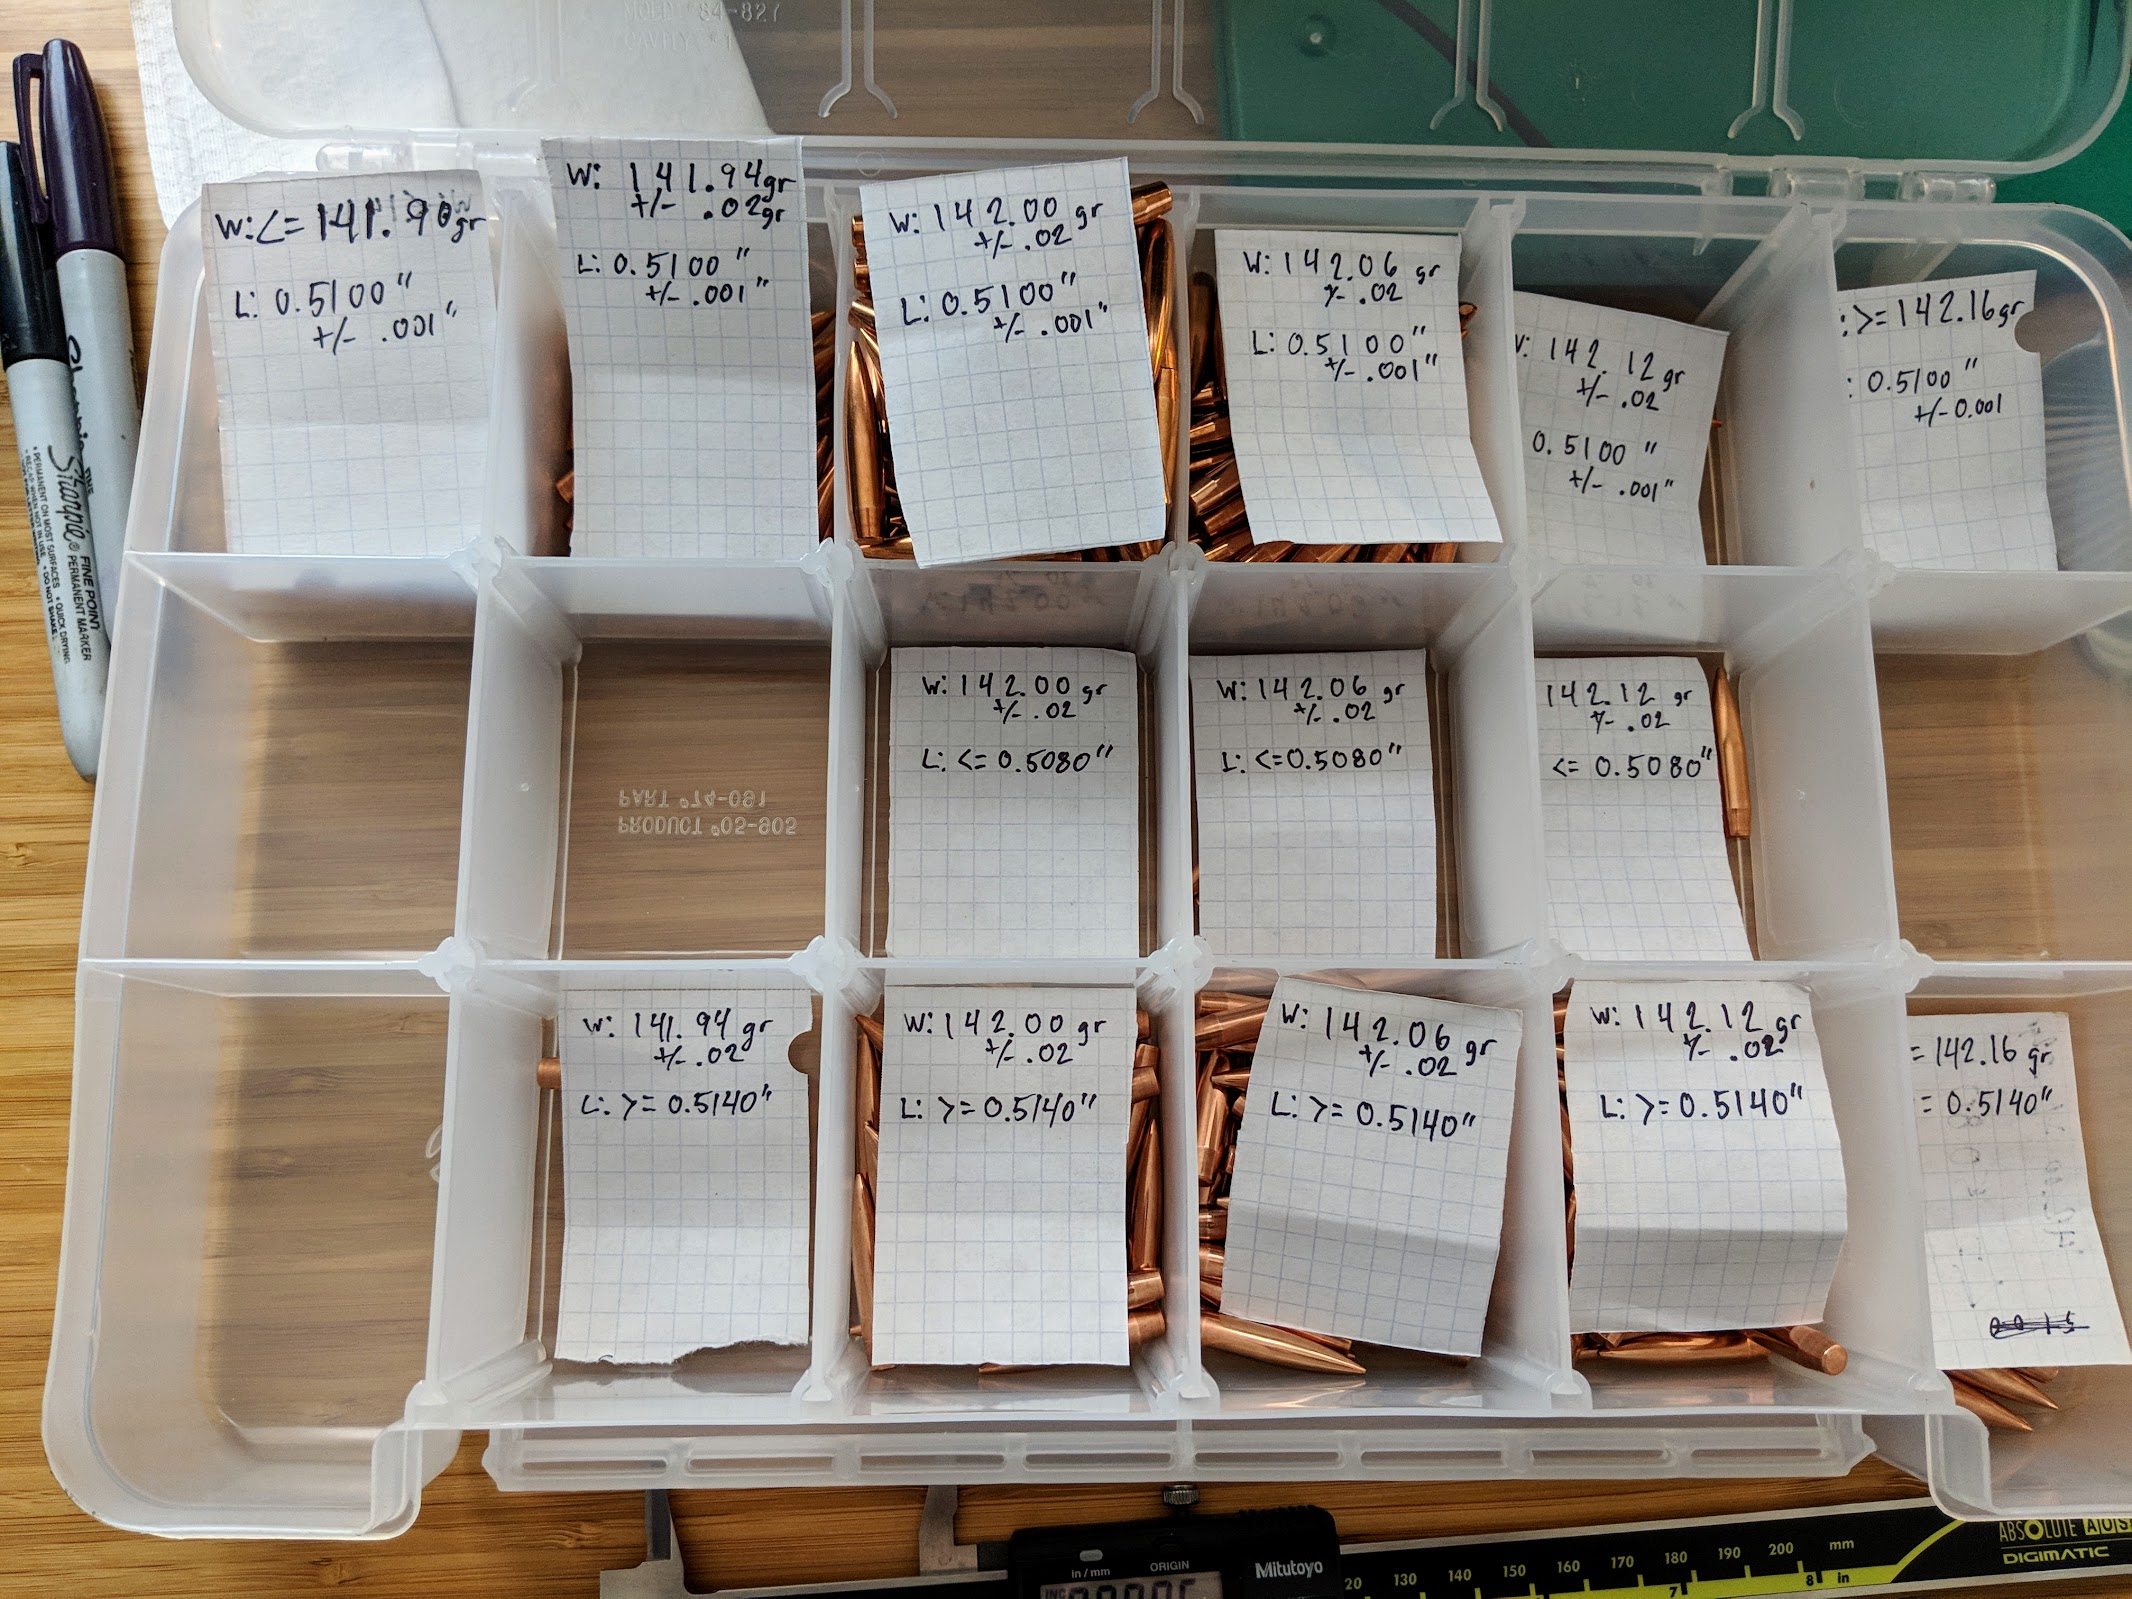
I first sorted by weight and then by bearing length, using a convenient small parts container and labels to keep things organized.
By Weight
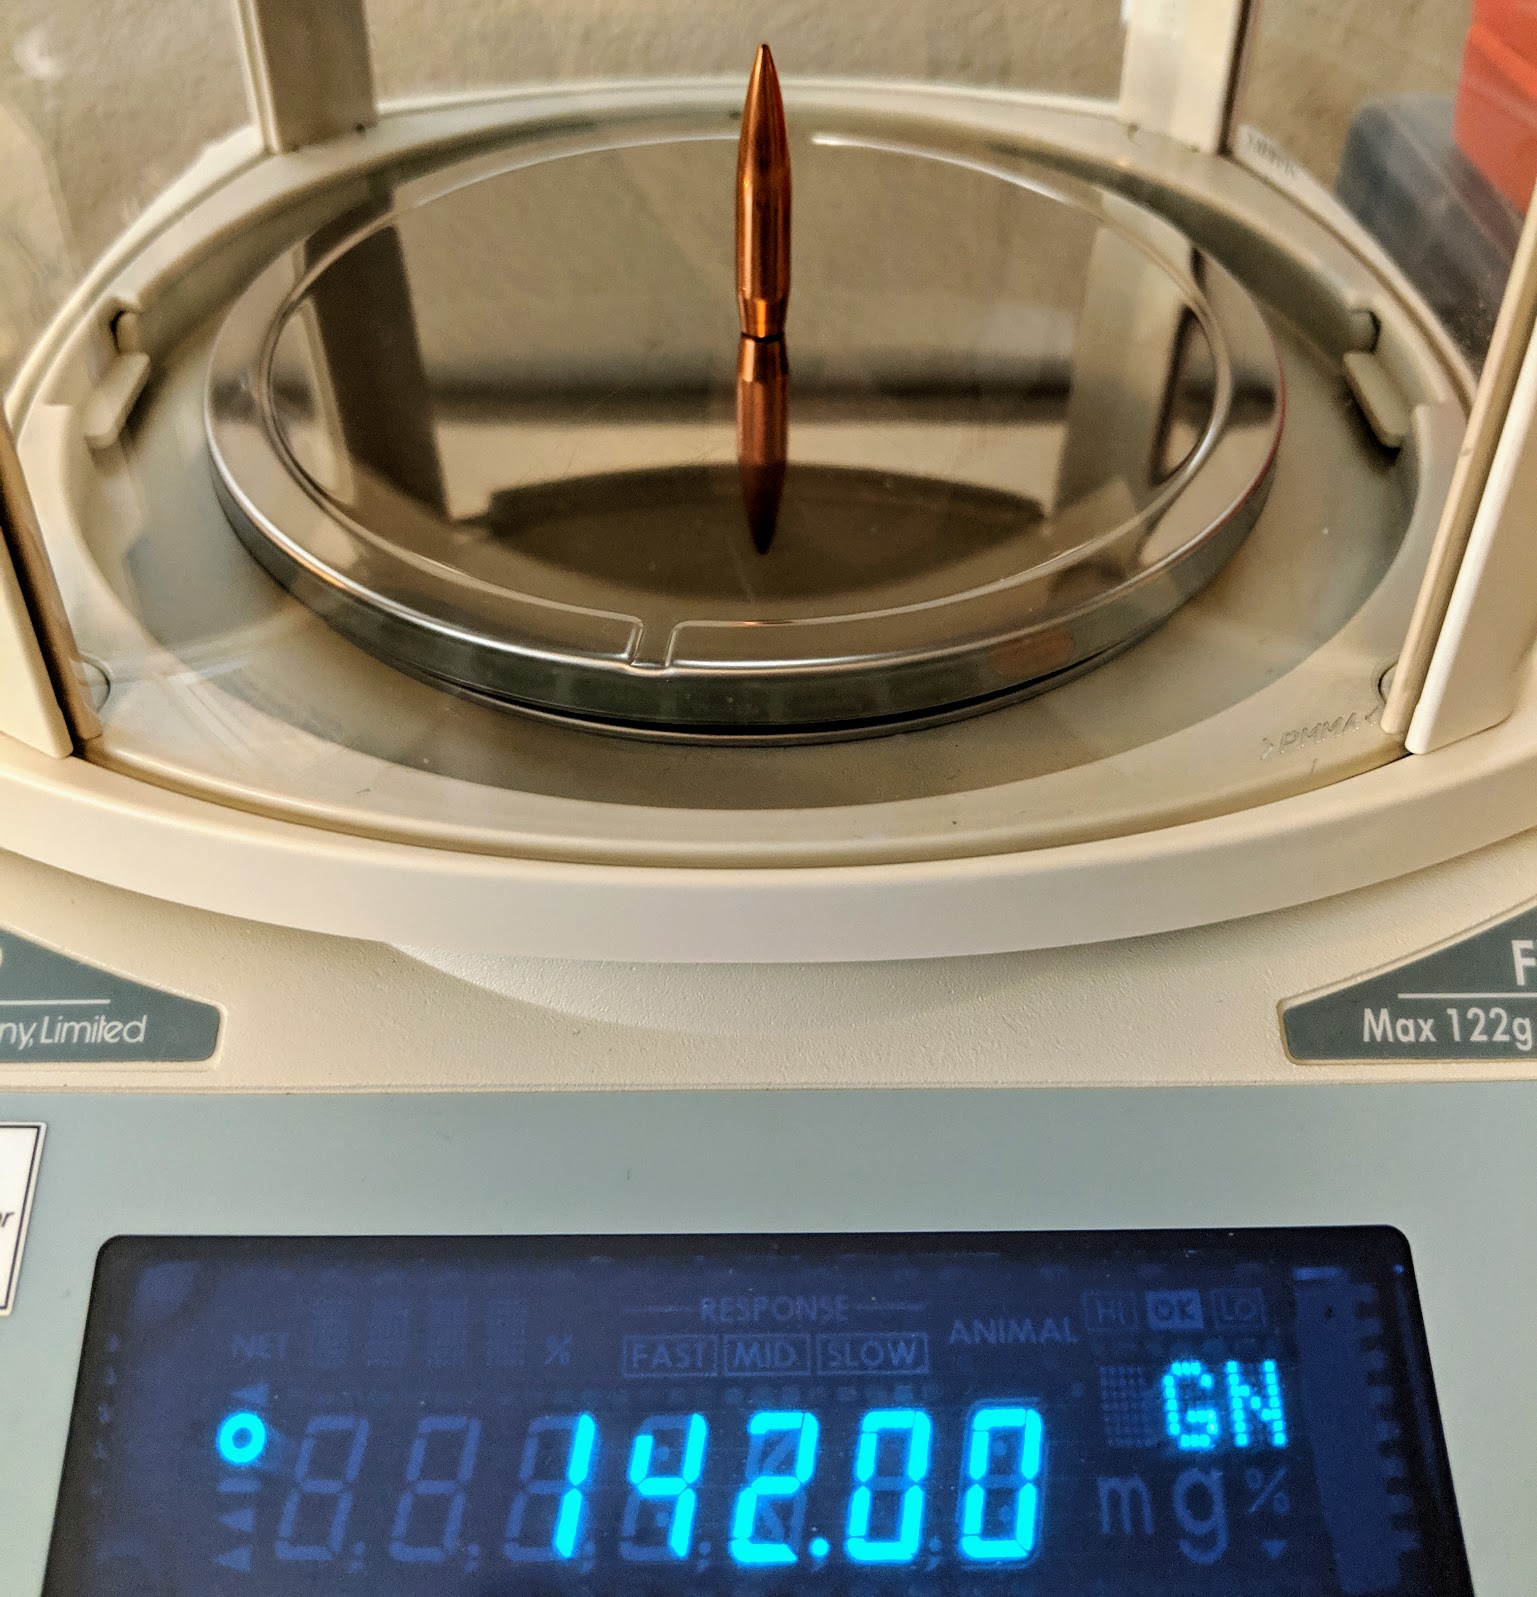
Equipment
While I present the weights in grains, I actually measured in grams since this scale offers a bit more precision with that unit.
| Unit | Abbrev | Conversion Factor (1 g =) | Minimum display |
|-
| Gram | g | 1 g | 0.001 |
| Grain | gr | 0.06479891 g | 0.02 |
From Chapter 5 of the FX-120i manual.
- 0.001 g = 0.0154 gr
- 0.02 gr = 0.0013 g
It’s not much, but I’ll take what I can get.
When using an electronic scale, some readings will toggle back an forth when the weight is right on that line of precision. To make it easier to decide which bin to put a bullet into in these cases, I used the following breakdown:
- ≤ 141.90 gr
- 141.94 gr ± 0.02 gr
- 142.00 gr ± 0.02 gr
- 142.06 gr ± 0.02 gr
- 142.12 gr ± 0.02 gr
- ≥ 142.16 gr
I didn’t bother to count how many bullets ended up each bin because I felt it would be too anecdotal and off-topic. Suffice it to say, it was a normal distribution across these weights.
By Bearing Length

Equipment
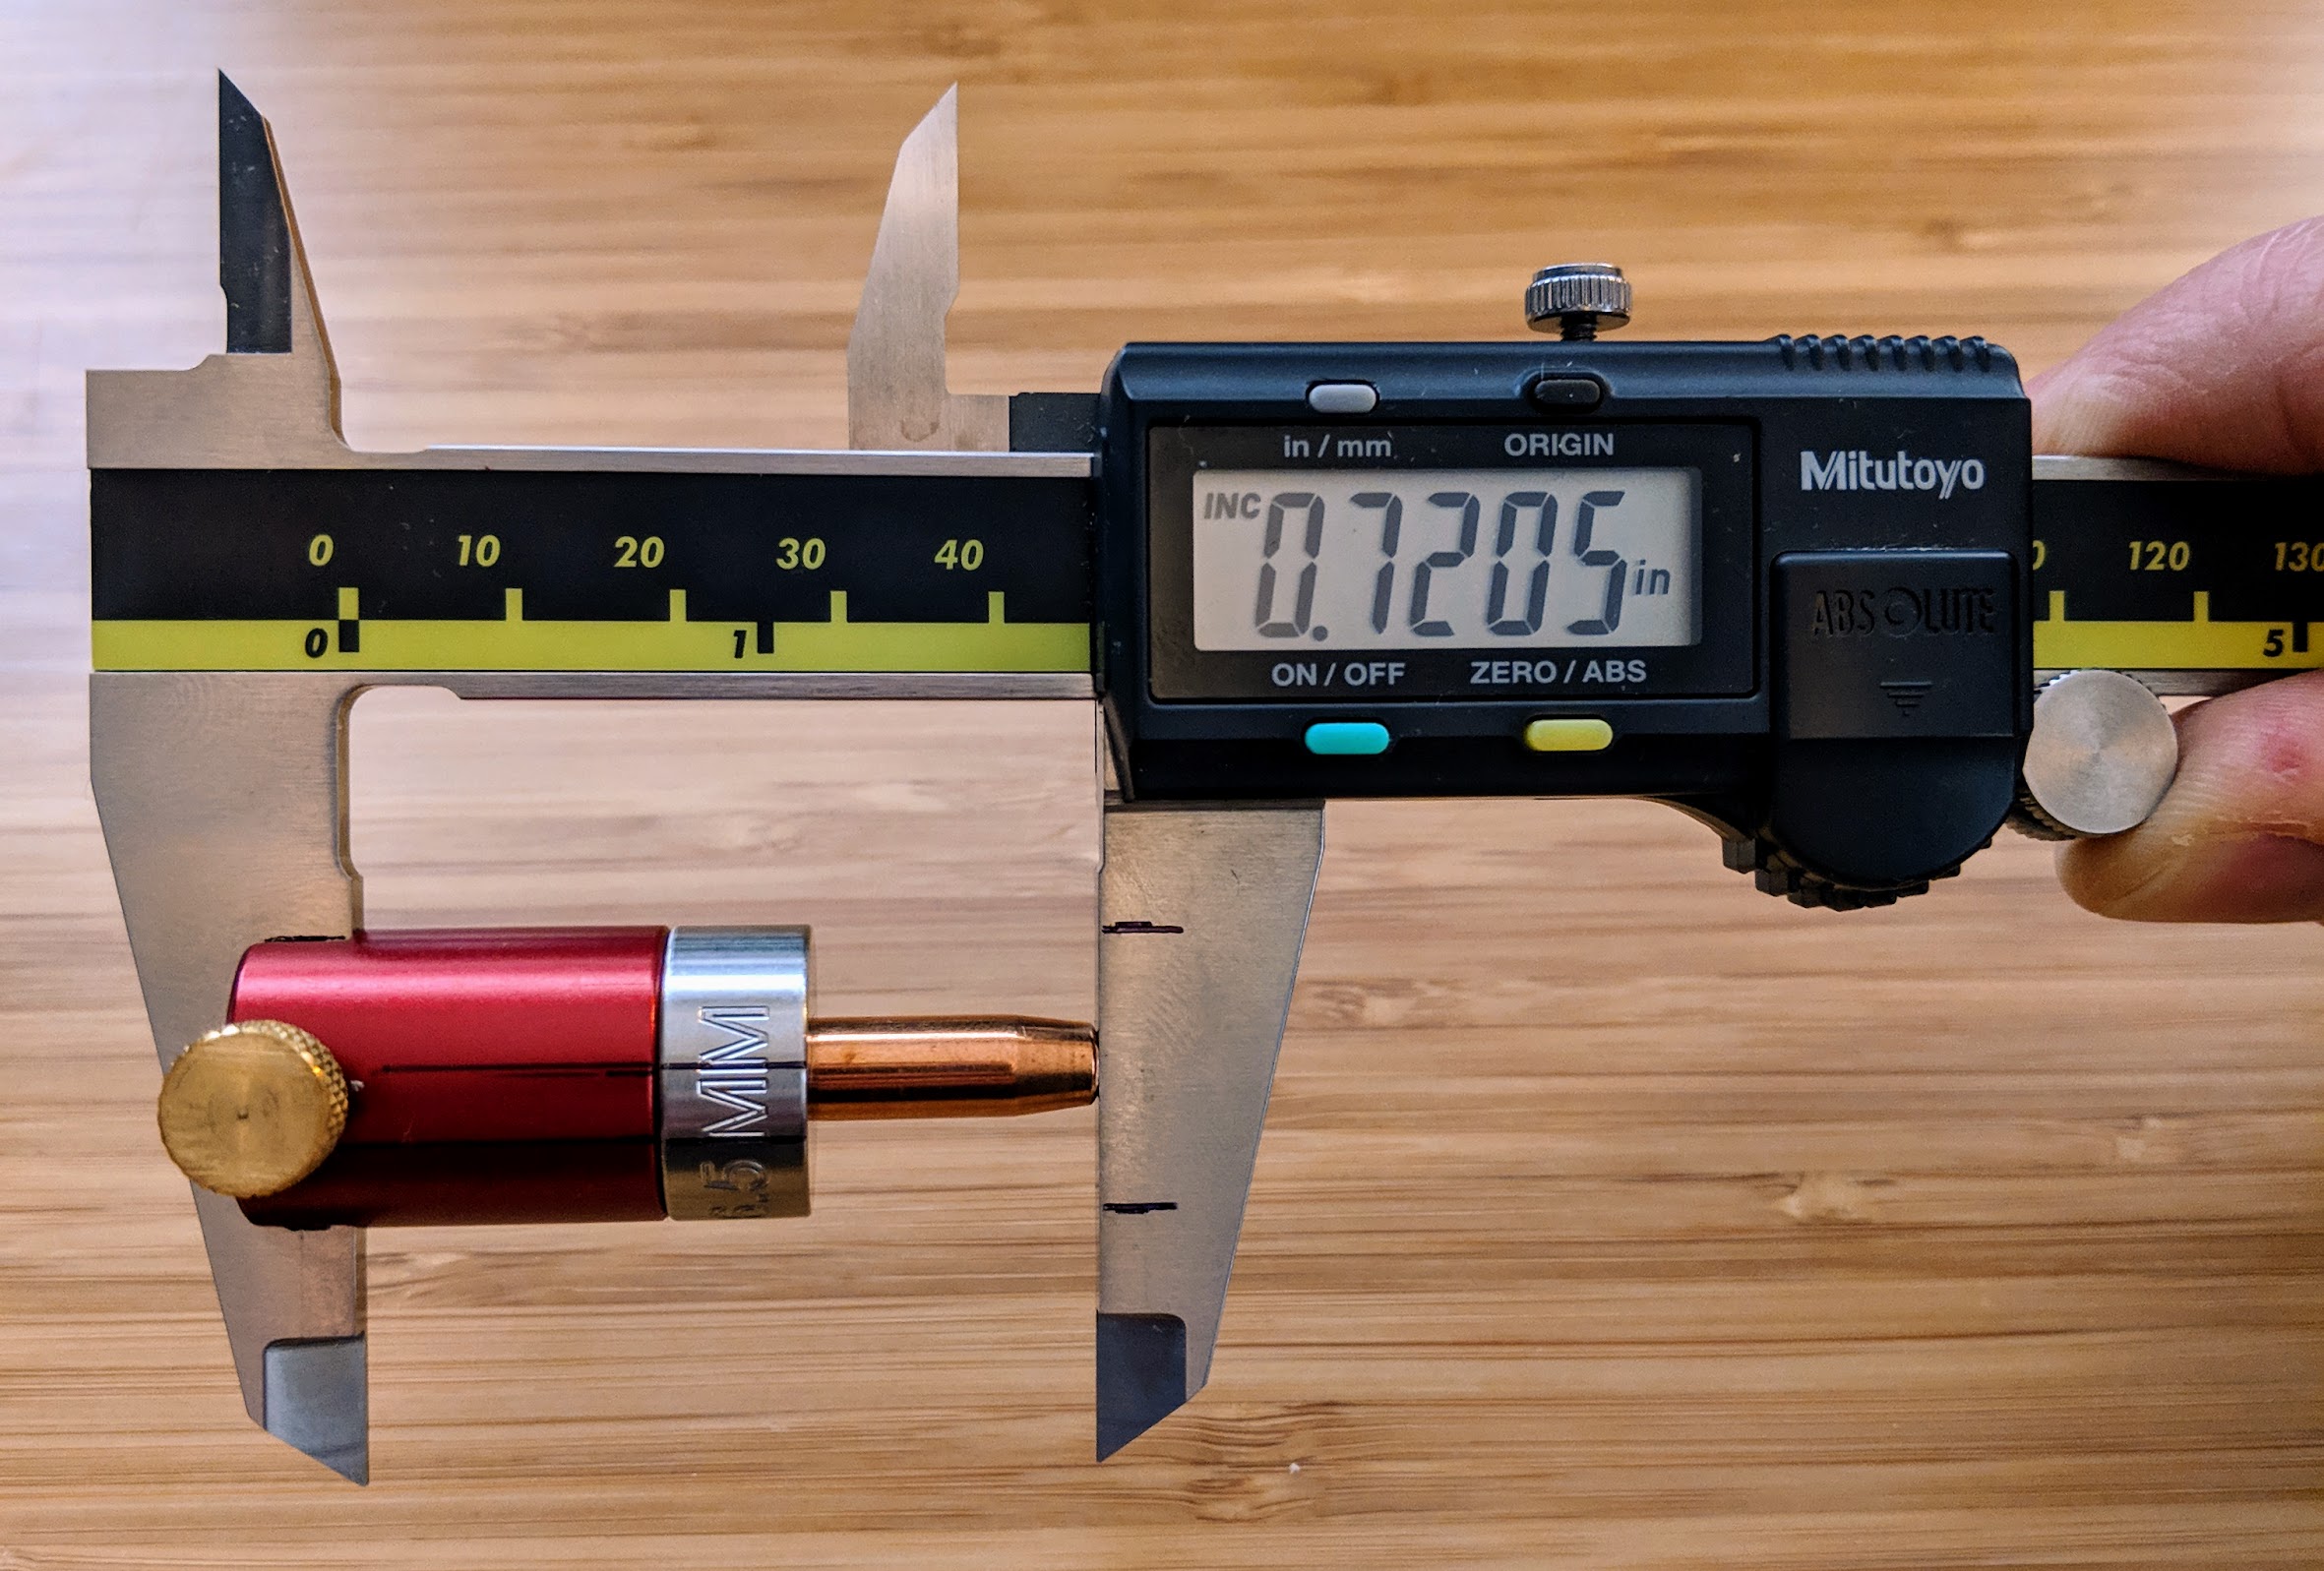
- Mitutoyo 8 inch digital calipers
- Hornady Comparators
- Sinclair Comparator Inserts
Note: Brownells recently removed these from their site, except for the 7mm version
As someone with fairly large hands, the 8-inch digital calipers are a huge improvement over the typical 6-inch as they provide much more grip and balance when measuring brass and loaded rounds with comparators attached.
These comparator inserts, on other hand, were quite problematic. I hoped switching from Hornady’s aluminum inserts to Sinclair’s steel inserts would have decreased measurement errors, but I was wrong. Regardless of the brand you use, the manufacturing quality lacks the level of precision required for absolute repeatability.
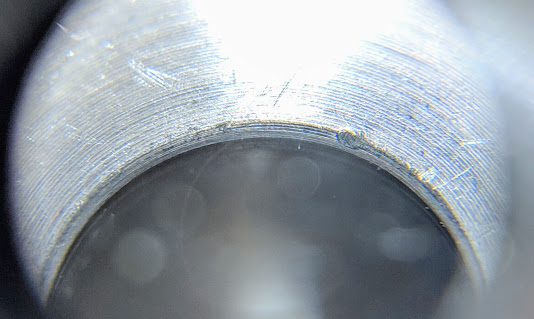
- If you turn the bullet around in your comparators, you’ll often get a different reading.
- Aligning the comparators perfectly is time-consuming and challenging.
- The comparator bases utilize a set screw, which does not hold the comparators in alignment.
There’s definitely room in the marketplace for a better product here.
By Base Length
I spot-checked the bullets from the largest piles after having sorted them by weight and bearing length. While bearing length does seem to be indicative of base length, I still found a few which were outside the norm.
I intended to include this dimension in my experiments, but there were not enough of the outliers to meet my sample size requirements. Also, sorting this many bullets by weight and two lengths takes a heck of a long time. I probably spent about 20 hours total going through all of these multiple times – a task I’m not eager to repeat.
How Much Variation is There?
Here’s a brief overview of the dimensional variation I saw in my batch of 142gr 0.264" Sierra MatchKings:
- Weight: 141.90gr - 142.18gr (Δ 0.28gr)
- Bearing: 0.5080" - 0.5140" (Δ 0.006")
Depending on your perspective, that will either seem normal or like an unacceptable level of variation which must be reduced. To get a better sense of it, let’s first convert these into percentages.
- Weight: 0.28gr / 142gr (nominal) = 0.197%
- Bearing: 0.006" / 0.5100" (nominal) = 1.177%
There’s nearly 6x more variation in bearing length than in weight. That may seem extreme, but we still need to determine how much these factors impact actual performance.
Predictions
Using the equation from Rifle Accuracy Facts, we can make some approximate predictions. I’ll use a generous 0.2 gr difference in bullet weight and my median muzzle velocity of 2773 ft/s (as recorded when firing 142.0 gr sorted bullets).
This suggests that we should expect ~1 ft/s change in muzzle velocity with this batch of bullets. Not much. The JBM ballistic calculator predicts the following changes in bullet drops:
| 142.0 gr @ 2773 ft/s | 142.2 gr @ 2774 ft/s | |||||
|---|---|---|---|---|---|---|
| Distance (yd) | inch | MOA | mil | inch | MOA | mil |
| 600 | -80.9 | -12.9 | -3.7 | -80.8 | -12.9 | -3.7 |
| 800 | -173.8 | -20.8 | -6.0 | -173.7 | -20.7 | -6.0 |
| 1000 | -319.0 | -30.5 | -8.9 | -318.7 | -30.4 | -8.9 |
| 1200 | -535.8 | -42.6 | -12.4 | -535.3 | -42.6 | -12.4 |
There should be no difference in bullet drop until 600 yards, then it’s about 0.1 inch. A competitive marksman might consider whether that differences means breaking the line for the X-ring or 10-ring. I suggest running these numbers for your own setup and judge for yourself.
Enough theory – let’s see if we can measure these effects in reality.
First Experiment - 22 rounds at 600 yards
My local F-Class league hosts a Saturday match each month where we have the opportunity to fire two consecutive strings of 22 rounds for score. I decided to use this opportunity to burn up one of my strings to conduct the first experiment.
The following datasets represent my second string of the day. I fired 25 rounds for the first string, then we took a 15 minute break to let the barrels cool off before shooting the second string. Our league allows us to fire fouling shots before our two sighers. As the name suggests, these are intended to clear any residue from the bore and to warm it up slightly. I fired three fouler shots before the rounds detailed below.
Note: Some readers had suggested that instead of firing all of the rounds for Group A followed by the rounds in Group B (e.g. AAA BBB), to fire them in a round-robin order (e.g. AB AB AB). This helps to reduce the chance that other variables, such as barrel fouling, will affect one group more than another. This is an excellent suggestion and I used it in both experiments.
Load Recipe
- Bullets: 142 gr .264 Sierra MatchKing
- Weight: 142.14 gr ±.02 gr
- Long:
- Bearing: 0.5200" ± .001 (12 rounds)
- Short:
- Bearing: 0.5120 ± 0.001" (10 rounds)
- Brass: Peterson Small Rifle Primer
- Once-fired
- Ultrasonic cleaned
- AMP annealed (program 71)
- 0.140" neck thickness
- Lot #: W1TL0095 QC050818
- Powder: Hodgdon H4350
- 41.5 gr (2.689 g ± 0.001 g)
- Lot #: 8032618 5804
- Primers: CCI BR-4 Small Rifle Primers
- 3.735 gr (0.242 g)
- Lot #: B25Z11
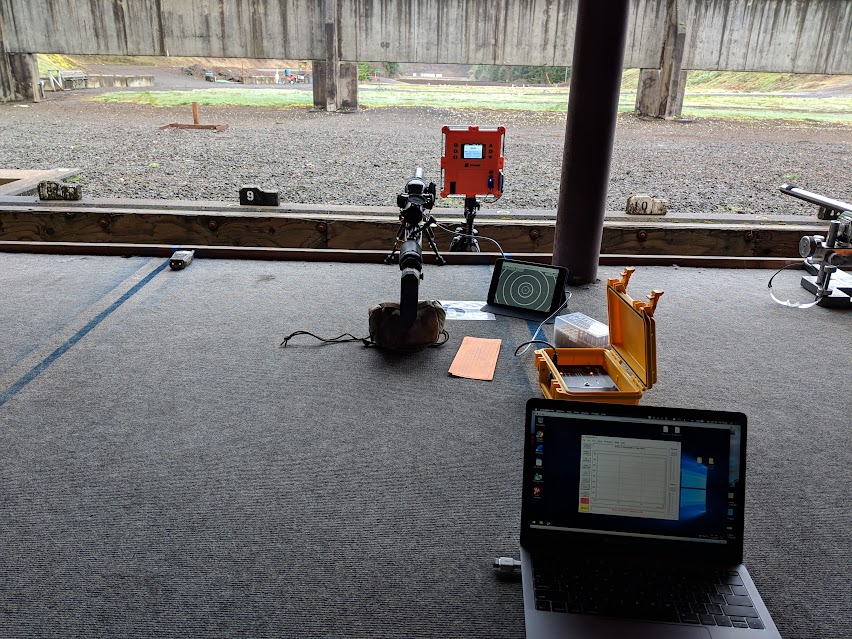
Muzzle and Target Velocity
Muzzle velocity data was collecting using a LabRadar chronograph and target velocity comes from the ShotMarker electronic target. This was my first time using either of these devices and each presented some challenges. The LabRadar was quite finicky and needed it’s position adjusted to correctly trigger when firing a suppressed rifle. The bluetooth connection between the unit and the app was also very flaky and frequently disconnected. Fortunately, it did successfully record each round during this experiment.
The only issue I had with the ShotMarker was that it detected a bad shot from the next target over before I had fired any rounds. This upset how it kept score and how it displayed subsequent rounds as I continued. The dataset it provided did not omit any data, which I found extremely helpful.
Generally speaking, it looks like the shorter bullets produced less overall variation in velocity than the longer bullets.
Before jumping to conclusions, let’s look at this from another angle. I noticed a high muzzle velocity range (extreme spread) in both experiments. The following chart indicates an upward trend in muzzle velocity over the time, suggesting a significant velocity shift of nearly 10 ft/s with barrel/chamber temperature.
I’m usually quite careful to avoid leaving an unfired round in the chamber and “cooking it” for too long before I’m ready to fire. Because these are timed & scored events, all 22 rounds must be fired within 22 minutes.
Target Hits
You’ll have to forgive my marksmanship. This certainly wasn’t my worst score, but the conditions were terrific and I definitely could have done better. Clearly my focus was on other things. I did come to the realization that my rear bag was frustratingly inconsistent. I’ve since swapped it for something more stable.
**Note:** Metric units are used by the ShotMarker for its coordinate system, which I reused for this chart.
The longer bullets had 1.1 inches (28 mm) more horizontal variation on target and the shorter bullets had 0.28 inches (7 mm) more vertical variation. Again, I did not shoot my best, so I’m not likely to conclude much from this.
Chamber Pressure
I recorded the chamber pressure for these rounds just to see if I could learn anything from it.
Second Experiment - 50 rounds at 300 yards
This next experiment was designed to measure multiple factors without the time constraint of firing during a match.
Unfortunately, there were several equipment failures and at least one human failure which prevent the datasets from being complete.
- The LabRadar chronograph failed to detect several shots.
Once was my fault for forgetting to “Arm” it – a feature which I really detest. - I dialed my windage turret in the wrong direction and my first hit left of the target. This confused me and the ShotMarker.
- The Pressure Trace system did not record my first sighter.
In this case, I had attempted to name the dataset before recording the shots, resulting in a prompt. The Windows-based software for this system is exceptionally frustrating.
When trying to conduct any type of experiment, lost data is extremely detrimental.
Load Recipe
- Bullets: 142 gr .264 Sierra MatchKing
- Ultralight/Short:
- Weight: 141.8 gr (9.189 g ± 0.001 g)
- Bearing: 0.5090" ± 0.0005"
- Base: 0.7200" ± 0.0005"
- Heavy/Short:
- Weight: 142.1 gr (9.208 g ± 0.001 g)
- Bearing: 0.5100" ± 0.0005"
- Base: 0.7205" ± 0.0005"
- Light/Short:
- Weight: 142.0 gr (9.202 g ± 0.001 g)
- Bearing: 0.5095" ± 0.0005"
- Base: 0.7205" ± 0.0005"
- Light/Long:
- Weight: 142.0 gr (9.202 g ± 0.001 g)
- Bearing: 0.5200" ± 0.0005"
- Base: 0.7265" ± 0.0005"
- Heavy/Long:
- Weight: 142.2 gr (9.213 g ± 0.002 g)
- Bearing: 0.5200" ± 0.0005"
- Base: 0.7275" ± 0.0005"
- Ultralight/Short:
- Brass: Peterson Small Rifle Primer
- Twice-fired
- Ultrasonic cleaned
- AMP annealed (program 71)
- 0.140" neck thickness
- Lot #: W1TL0095 QC050818
- Powder: Hodgdon H4350
- 41.50 gr (2.689 g)
- Lot #: 8032618 5804
- Primers: CCI BR-4 Small Rifle Primers
- 3.719 gr (0.241 g)
- Lot #: B25Z11
Muzzle and Target Velocity
The LabRadar chronograph failed me a few times during this test and did not record Shots 3, 4, 6, 7, 9, 10, and 11. At least one of those was my fault for forgetting to “Arm” the system, but the rest were due to it’s apparent incompatibility with suppressed rifles. It supports Doppler mode and has an external microphone accessory to help with this, but because I was borrowing the system, I didn’t want to fiddle with the settings too much. If you’ve ever let someone else drive your car and they return it with the seat, mirrors, and steering wheel in a different position… Well, I didn’t want to be that guy.
Anyway, the unfortunate result of this data loss is that it turns my 10-round samples into 8 and 9 round samples – a bit less than I consider to be statisitically significant.
Referring back to our muzzle velocity predictions, we should expect the heavier bullets to be ~1 ft/s slower than the light bullets. When comparing the median velocities, the results are mixed. The Ultralight/Short group was 2 ft/s faster than the Heavy/Short group, but the Light/Short and Heavy/Short groups were the same. Conversely, the Heavy/Long group’s median muzzle velocity was 3 ft/s faster than the Light/Long group. Again, without a large enough sample size, it’s difficult to draw conclusions.
Fortunately, the ShotMarker target system also records bullet velocity, so it wasn’t a total loss. The more I use this electronic target, the more I like it. Let’s compare the complete data sets of target velocities to see what we can learn.
Interesting. Amongst the shorter bullets, the heavier group exhibits a median velocity that’s 3-7 ft/s faster than the lighter bullets. Again, the results are reversed in the group of longer bullets, in which the lighter bullets had a median velocity 5 ft/s faster than the heavier bullets.
Taking another look at the muzzle velocity trendline over time and the increase is evident once again.
Target Hits
I used an MR-63 target for this string, which is a 600 yard simulation target designed for use at 300 yards. Because the ShotMarker system I borrowed was mounted on a frame intended for the MR-1 target, the resulting dataset is offset slightly compared to the actual paper target. It doesn’t matter for the purposes of this experiment.
For reference, the X-Ring is 1.42 inches in diameter and the 10-Ring is 2.85 inches.
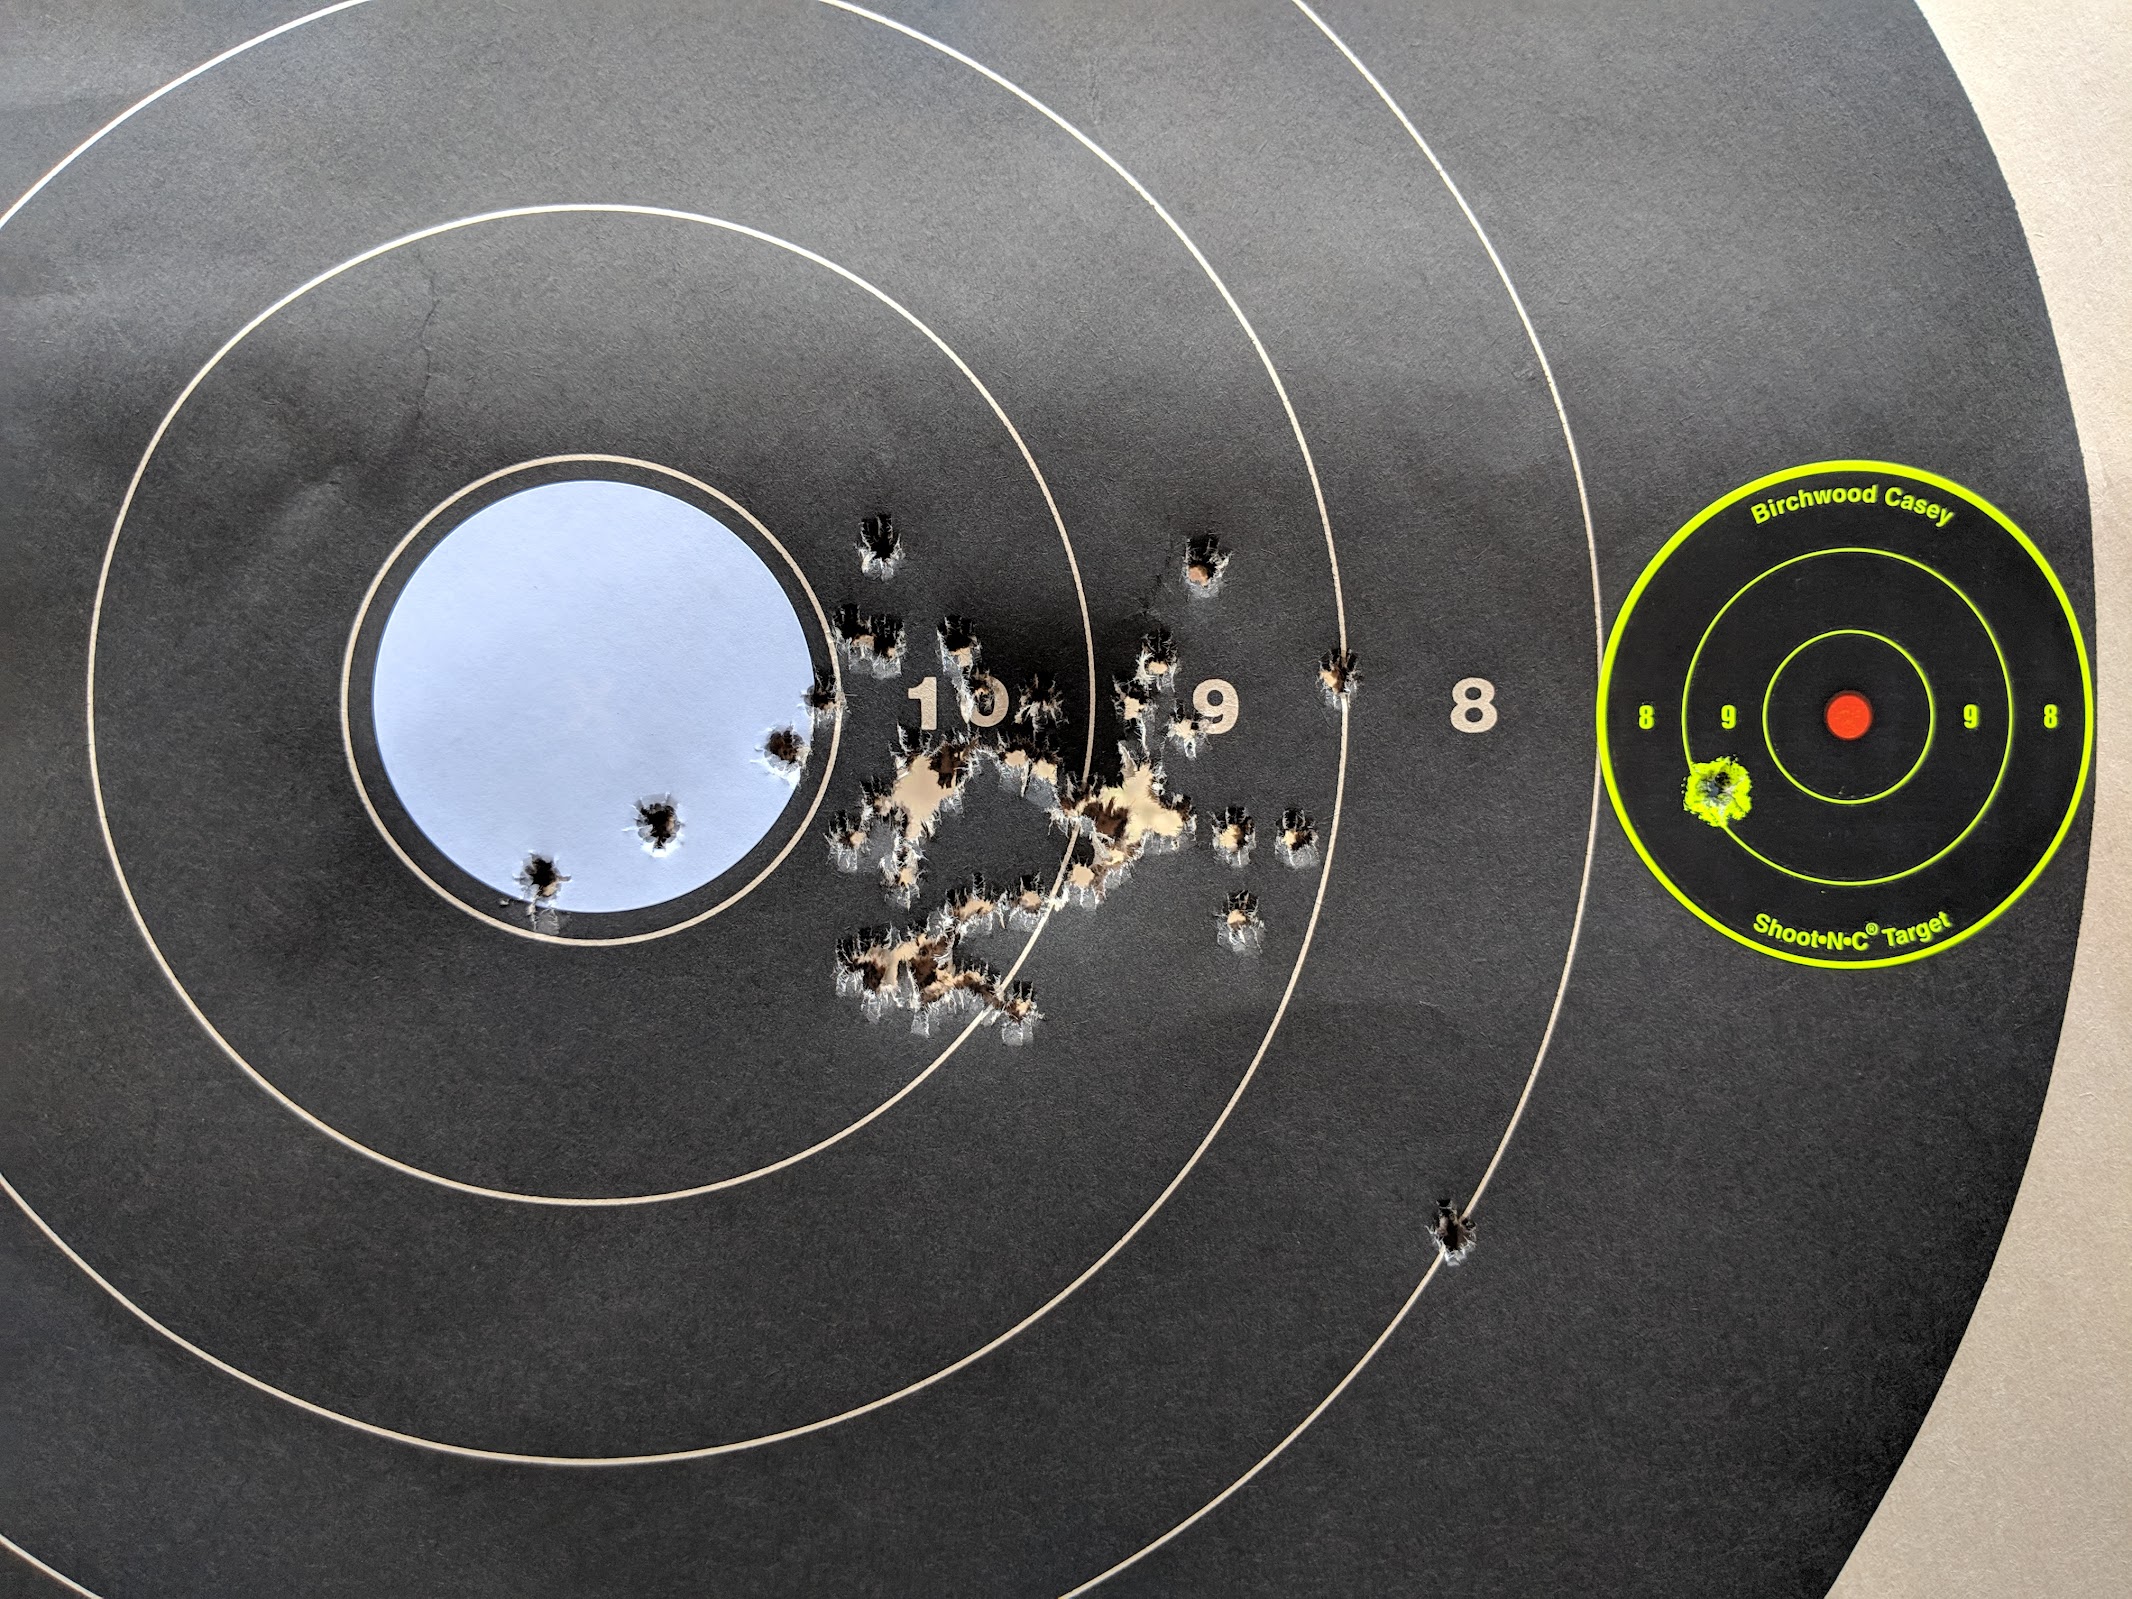
Why are all of the impacts right of center? That’s actually not from misalignment of the electronic target. The friend who loaned me the target suggested that I adjust the windage turrets on my scope and aim at an off-center sticker target. That way my point of aim would not be affected by bullet impacts. Great suggestion!
Unfortunately, I made a rookie mistake and dialed the wrong direction, so the first shot for this experiment landed to the left of the target. Whoops.
I’m not convinced there’s much to learn from the target in this case. I felt rushed without a good reason and didn’t shoot my best, despite having plenty of time, excellent conditions, and a nearly empty range to myself. That is, until two others showed up and decided they needed to use the lane right next to me to fire their incredibly loud 300 Win Mag. I humbly submit that men’s restroom etiquette be followed at the range.
Moving on…
Chamber Pressure
According to Rifle Accuracy Facts, heavier bullets should exhibit a higher peak chamber pressure and reach it sooner. With the data from the Pressure Trace system, let’s see if we can confirm this.
Note: The software for the Pressure Trace system requires the muzzle velocity for post-processing calculations. Since some of those are missing, not all data is available.
So far so good. The Heavy/Long group had a ~140 psi greater median peak pressure than the Light/Long group. The Heavy/Short group had a ~470 psi greater median peak pressure than the Ultralight/Short group and ~388 psi greater than the Light/Short group. These results are consistent and consistent with his predictions.
How about the time to peak pressure (aka Rise Time)?
In this case, the values provided by the Pressure Trace software are a bit strange. According to the documentation, it defines Rise Time as:
the time (in microseconds) it takes for the pressure to rise from 25% of the peak value to 75% of the peak value.
Notice that all values are segmented, which makes me question its method of calculating thes figures. Furthermore, I’d prefer to have the entire rise time of the pressure curve instead of just the middle 50%. I’m not certain why they chose to implement it that way but I will ask and provide an update when I learn more.
Still, the median rise time for the Heavy/Short group was 5 μs faster than the Ultralight/Short and Light/Short groups. It is odd to see no difference between the Heavy/Long and Heavy/Short groups, or any between the Ultralight/Short and Light/Short. At least we have some data to confirm the predictions from Rifle Accuracy Facts.
I may try to extract the actual rise time from the raw dataset in the future.
Closing Thoughts
I like to end my articles with the conclusions I made from my experiments. This time, I don’t have anything that I’d be comfortable stating as conclusive. Instead, I’ll close out with some things I learned from this process.
- Mo' Data, Mo' Problems
In this article, I used some simple data analysis and visualization techniques to draw some conclusions. The problem is that this is not a simple dataset and more advanced techniques will be required to find the answers we’re looking for. In a future article on this series, I’ll leverage Multivariate Analysis to account for the number of variables involved. - Imperfect equipment
I was frusted by many of the tools I used during this process. The Hornady and Sinclair comparator inserts both left a lot to be desired in terms of quality. The LabRadar system is quite finicky and is not well suited for suppressed rifles in my opinion. The Pressure Trace software is designed around a 10-round SAAMI test, which is challenging for other use-cases. - Imperfect marksmanship
It’s customary to blame ugly targets on the tools or the weather. In this case, I’ll simply admit that I could have done better. I need to exercise more patience when conducting these experiments to avoid the feeling of being rushed, which can only lead to more mistakes.
Next Steps
- To be continued
I’ll experiment with this topic again in the future. For now, I need to take a break from sorting bullets. - Related experiments
There are other variables that I’ll investigate next which may be more impactful, such as brass sorting and primer sorting. - Have questions or feedback?
You can discuss this project with me on Reddit. - Contribute
Ammolytics is a community-supported project to keep it free of ads and paid-promotions. Making purchases using the affiliate links on this site helps to fund future projects and experiments. You can also support Ammolytics on Patreon!
Special thanks
- To my wife, for her incredible patience and support.
- To John Masek, for letting me borrow his LabRadar chronograph and ShotMarker target.
- To the F-Class league at Tri-County Gun Club, for their patience and understanding while I wrangled all of my equipment during matches.
Before you go…
Thanks for taking the time to read this article! I enjoyed writing it and learned a lot in this process and I hope that you did too. If you have any feedback, you can email me directly if you don’t prefer to use Reddit or other social media.